Equity, Diversity and Inclusion in CIHR Funding Programs
In May 2018, CIHR, along with the other federal funding agencies, launched a Tri-Agency self-identification Equity and Diversity Questionnaire for applicants to all funding competitions. The collection of this data marked an important first step in enabling CIHR to identify and understand potential inequities, underrepresentation or exclusions within our funding system.
In 2020, the questionnaire collected data on age, gender, and whether applicants identify as Indigenous, a visible minority or a person with a disability. We are pleased to share summary findings from an analysis of self-identification data across CIHR’s COVID-19 funding competitions launched from February to November 2020.
The data presented below are from a subset of targeted funding opportunities only and do not include data from directed funding opportunities. CIHR will continue to closely monitor new data moving forward and are committed to working with the community to find solutions to address identified inequities.
2020 COVID-19 Competitions
The COVID-19 pandemic has exacerbated existing inequities in the research system.Footnote 1 The results of CIHR’s first rapid response COVID-19 competition, launched in February 2020, pointed to inequities between male and female applicants. Application rates were disproportionately low for female applicants relative to male applicants, compared to application rates for the Spring 2019 Project Grant competition. Given this context, the analysis below examined if differences between groups of applicants could be determined across COVID-19 competitions. The analysis also examined how groups of applicants across all COVID-19 competitions compared to CIHR’s 2019 Spring Project competition, which is considered a more consistent competitionFootnote 2 that also took place prior to the pandemic.
Methods
The data in this section represent the self-identification questionnaire responses submitted by Nominated Principal Investigators who applied to CIHR’s COVID-19 competitions launched between February and November 2020. If the total number of applicants who identified as being in a group was less than 5, the data for that group is not published. A mix of statistical analyses and visual interpretation of the data was conducted.Footnote 3
Subset of Funding Competitions included in Analysis
- 202002COV – Operating Grant: Canadian 2019 Novel Coronavirus (COVID‐19)
- 202004FRC – Operating Grant: Frailty and COVID‐19
- 202004SBC – Op Grant: Sex as a biological Variable Supplement: COVID-19 Rapid Research FO
- 202005CMS – Operating Grant: Knowledge Synthesis: COVID-19 in Mental Health & Substance Use
- 202005CVR – Operating Grant: COVID‐19 May 2020 Rapid Research Funding Opportunity
- 202007MSU – Operating Grant: COVID‐19 Mental Health & Substance Use Service Needs/Delivery
- 202009SPP – Operating Grant: Strengthening Pandemic Preparedness in Long-Term Care (COVID-19)
- 202011EVO – Op. Grant: Evaluation of Harm Reduction Approaches to Address the Opioid Crisis
- 202011NCN – Op Gr: Network of Clinical Trials Networks: COVID-19 and Intervention Strategies
Overall Conclusions
- Across groups of applicants, statistical differences between the proportion of applicants and the proportion of successful applicants were not observed.
- Across groups of applicants, visual interpretation of the data identified no obvious differences between success rates of the COVID-19 competitions and the 2019 Spring Project competition.
- The first rapid response COVID-19 competition launched in February 2020 shows a disproportionately low application rate for female applicants.Footnote 4 However, across the subset of combined COVID-19 competitions, the only observable difference was that women requested and received smaller funding amounts than men.
Limitations
- No data are presented for applicants who identified as gender-fluid, non-binary and/or two-spirit because group sizes for proportion of applicants, proportion of successful applicants, success rates, amount requested and amount received were less than 5.
- COVID-19 competitions included in this analysis varied substantially by the number of applicants, the topic, team size, amount requested and other factors. Combining data across these varied competitions does not account for the subtleties observed within each competition, and future analyses could consider the impact of these differences on measures of equity.
Visible Minority
Do you self-identify as a visible minority?
Figure A - Proportion of applicants
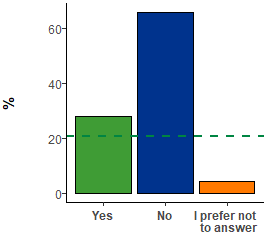
Figure A: Long description
- Yes: 28.2%
- No: 65.7%
- I prefer not to answer: 4.4%
Figure B - Proportion of successful applicants
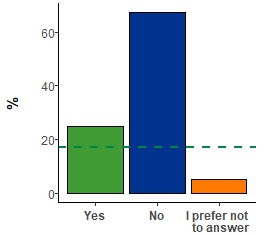
Figure B: Long description
- Yes: 25.0%
- No: 67.1%
- I prefer not to answer: 5.1%
Figure C - Amount requested (in thousand $)
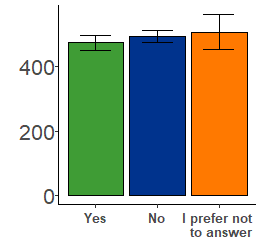
Figure C: Long description
- Yes: $474,732 ± $22,804
- No: $495,090 ± $18,665
- I prefer not to answer: $507,700 ± $53,800
Figure D - Amount awarded (in thousand $)
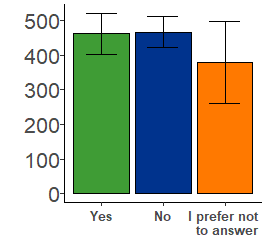
Figure D: Long description
- Yes: $461,657 ± $59,238
- No: $466,465 ± $44,139
- I prefer not to answer: $378,534 ± $117,211
Figure E - Success rate
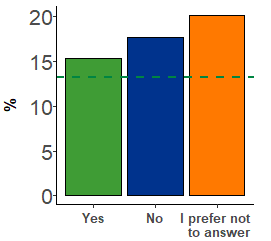
Figure E: Long description
- Yes: 15.4%
- No: 17.7%
- I prefer not to answer: 20.2%
For those who identified as a visible minority, there were no observed differences across A) Proportion of applicants; B) Proportion of successful applicants; C) Amount requested; and D) Amount awarded). E) Visual interpretation of the graph suggests that the success rate for visible minorities is lower than other groups. Dotted lines represent the proportion of applicants, proportion of successful applicants and success rate for visible minorities in the Spring 2019 Project competition.
| Do you self-identify as a visible minority? | Proportion of applicants | Proportion of successful applicants | Amount requested | Amount awarded | Success rate |
|---|---|---|---|---|---|
| Yes | 28.2% | 25.0% | $474,732 ± $22,804 | $461,657 ± $59,238 | 15.4% |
| No | 65.7% | 67.1% | $495,090 ± $18,665 | $466,465 ± $44,139 | 17.7% |
| I prefer not to answer | 4.4% | 5.1% | $507,700 ± $53,800 | $378,534 ± $117,211 | 20.2% |
|
Note that not all proportions add up to 100% due to missing data. |
|||||
Indigenous Peoples
Do you self-identify as a an Indigenous person?
Figure A - Proportion of applicants
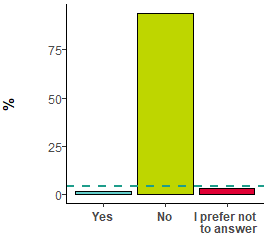
Figure A: Long description
- Yes: 1.3%
- No: 93.6%
- I prefer not to answer: 3.3%
Figure B - Proportion of successful applicants
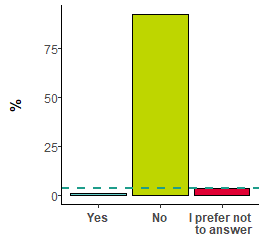
Figure B: Long description
- Yes: 1.3%
- No: 92.3%
- I prefer not to answer: 3.6%
Figure C - Amount requested (in thousand $)
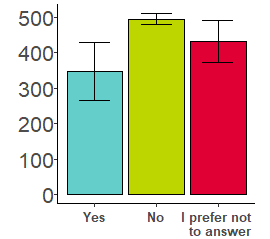
Figure C: Long description
- Yes: $346,484 ± $81,834
- No: $493,920 ± $14,791
- I prefer not to answer: $431,063 ± $60,112
Figure D - Amount awarded (in thousand $)
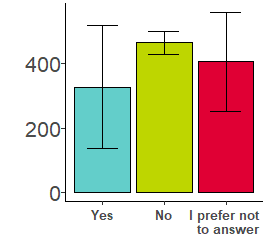
Figure D: Long description
- Yes: $327,181 ± $189,842
- No: $464,494 ± $35,834
- I prefer not to answer: $406,037 ± $153,773
Figure E - Success rate
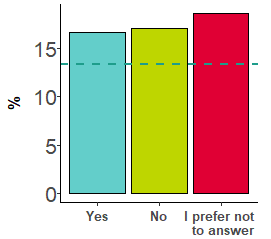
Figure E: Long description
- Yes: 16.7%
- No: 17.1%
- I prefer not to answer: 18.7%
For those who identified as Indigenous, there were no observed differences across A) Proportion of applicants; B) Proportion of successful applicants; C) Amount requested; and D) Amount awarded). E) Visual interpretation of the graph suggests that the success rate for Indigenous Peoples is comparable to applicants that did not identify as Indigenous. Dotted lines represent the proportion of applicants, proportion of successful applicants and success rate for Indigenous Peoples in the Spring 2019 Project competition.
| Do you self-identify as an Indigenous person? | Proportion of applicants | Proportion of successful applicants | Amount requested | Amount awarded | Success rate |
|---|---|---|---|---|---|
| Yes | 1.3% | 1.3% | $346,484 ± $81,834 | $327,181 ± $189,842 | 16.7% |
| No | 93.6% | 92.3% | $493,920 ± $14,791 | $464,494 ± $35,834 | 17.1% |
| I prefer not to answer | 3.3% | 3.6% | $431,063 ± $60,112 | $406,037 ± $153,773 | 18.7% |
|
Note that not all proportions add up to 100% due to missing data. |
|||||
Persons with a Disability
Do you self-identify as a person with disabilities?
Figure A - Proportion of applicants
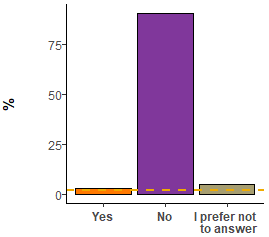
Figure A: Long description
- Yes: 3.2%
- No: 90.1%
- I prefer not to answer: 4.9%
Figure B - Proportion of successful applicants
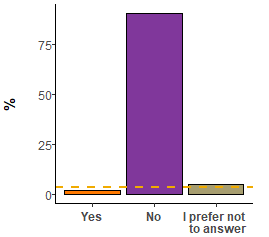
Figure B: Long description
- Yes: 2.0%
- No: 90.3%
- I prefer not to answer: 4.9%
Figure C - Amount requested (in thousand $)
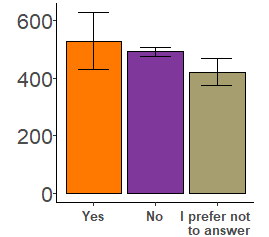
Figure C: Long description
- Yes: $528,257 ± $98,803
- No: $492,165 ± $14,950
- I prefer not to answer: $421,261 ± $47,067
Figure D - Amount awarded (in thousand $)
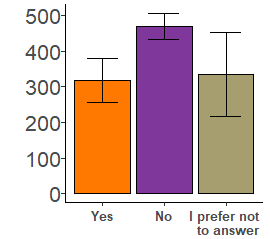
Figure D: Long description
- Yes: $317,976 ± $62,270
- No: $470,458 ± $36,609
- I prefer not to answer: $335,853 ± $118,180
Figure E - Success rate
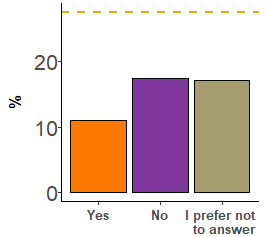
Figure E: Long description
- Yes: 11.0%
- No: 17.4%
- I prefer not to answer: 17.1%
For those who identified as persons with a disability, there were no observed differences across (A) Proportion of applicants; B) Proportion of successful applicants; C) Amount requested; and D) Amount awarded). E) Visual interpretation of the graph suggests that the success rate for persons with a disability is lower than other groups. Dotted lines represent the proportion of applicants, proportion of successful applicants and success rate for persons with a disability in the Spring 2019 Project competition.
| Do you self-identify as a person with disabilities? | Proportion of applicants | Proportion of successful applicants | Amount requested | Amount awarded | Success rate |
|---|---|---|---|---|---|
| Yes | 3.2% | 2.0% | $528,257 ± $98,803 | $317,976 ± $62,270 | 11.0% |
| No | 90.1% | 90.3% | $492,165 ± $14,950 | $470,458 ± $36,609 | 17.4% |
| I prefer not to answer | 4.9% | 4.9% | $421,261 ± $47,067 | $335,853 ± $118,180 | 17.1% |
|
Note that not all proportions add up to 100% due to missing data. |
|||||
Gender
What is your gender?
Figure A - Proportion of applicants
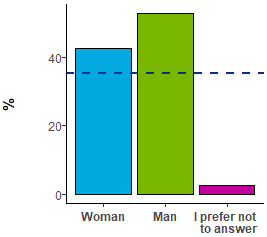
Figure A: Long description
- Woman: 42.6%
- Man: 52.6%
- I prefer not to answer: 2.7%
Figure B - Proportion of successful applicants
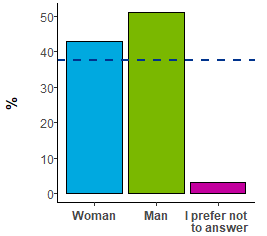
Figure B: Long description
- Woman:: 42.9%
- Man: 51.0%
- I prefer not to answer: 3.1%
Figure C - Amount requested (in thousand $)
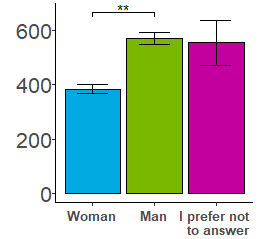
Figure C: Long description
- Woman: $383,418 ± $16,542
- Man: $569,415 ± $22,165
- I prefer not to answer: $553,641 ± $82,686
**p < 0.01
Figure D - Amount awarded (in thousand $)
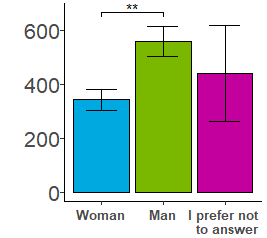
Figure D: Long description
- Woman: $343,816 ± $39,516
- Man: $559,502 ± $55,074
- I prefer not to answer: $442,142 ± $178,080
**p < 0.01
Figure E - Success rate
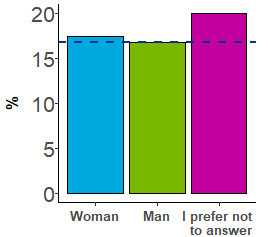
Figure E: Long description
- Woman: 17.4%
- Man: 16.8%
- I prefer not to answer: 20.0%
For those who identified as women or men, there were no observed differences across A) Proportion of applicants and B) Proportion of successful applicants. C) Amount requested and D) Amount awarded were significantly different for women as compared to men. E) Visual interpretation of the graph suggests that success rates for women and men are comparable. Dotted lines represent the proportion of applicants, proportion of successful applicants and success rate for women in the Spring 2019 Project competition.
| What is your gender? | Proportion of applicants | Proportion of successful applicants | Amount requested | Amount awarded | Success rate |
|---|---|---|---|---|---|
| Woman | 42.6% | 42.9% | $383,418 ± $16,532 | $343,816 ± $39,516 | 17.4% |
| Man | 52.6% | 51.0% | $569,415 ± $22,165 | $559,502 ± $55,074 | 16.8% |
| I prefer not to answer | 2.7% | 3.1% | $553,641 ± $82,686 | $442,142 ± $178,080 | 20.0% |
|
Note that not all proportions add up to 100% due to missing data. |
|||||
- Date modified: